


PV Module IV Curves: Understanding Solar Performance
Understanding how a photovoltaic (PV) module is performing is about more than looking at the energy produced by a solar plant. Production data can show that performance has changed, but it does not always explain why.
An I-V curve, or current-voltage curve, provides a more detailed view of the electrical behaviour of a PV module or string. By examining the relationship between current and voltage across the operating range, engineers can identify changes in electrical performance that may otherwise remain hidden in normal production data.
IV curve analysis is used during commissioning, troubleshooting and ongoing performance assessment of photovoltaic systems.
What is a PV module IV curve?
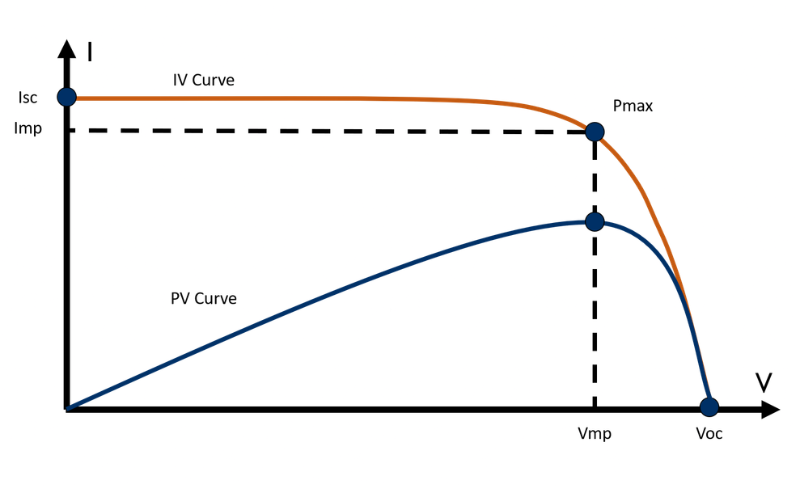
A PV module IV curve is a graphical representation of the relationship between the current and voltage produced by a photovoltaic module under defined operating conditions.
The shape of the curve is determined by the electrical characteristics of the photovoltaic cells, including the photocurrent generated by incident light, the cell’s diode behaviour, recombination effects and resistive losses within the module.
Two important point
s define the ends of the curve:
- Short-circuit current (Isc): The current produced when the module voltage is zero.
- Open-circuit voltage (Voc): The voltage measured when no current is flowing.
Between these points is the modu
le’s operating range. The maximum power point (MPP) occurs at the point where the product of current and voltage is greatest.
Pmax = Vmp × Imp
Where:
- Pmax is the maximum power
- Vmp is the voltage at maximum power
- Imp is the current at maximum power
The shape of the IV curve provides considerably more information than simply measuring the module’s output at one operating point.
Why does the IV curve matter?
PV modules are affected by their operating environment and by changes that occur within the module over time.
A module can produce less power because of high cell temperature, reduced irradiance, soiling, shading, mismatch, electrical resistance or degradation. These conditions can produce different changes in the IV curve.
This makes IV curve analysis useful for investigating possible causes of reduced performance.
For example, changes in short-circuit current can be associated with changes in irradiance, soiling or shading, while changes in voltage can be associated with cell temperature and other electrical characteristics.
The shape of the curve is particularly useful because some conditions produce characteristic changes or distortions rather than simply reducing the overall output.
The effect of irradiance
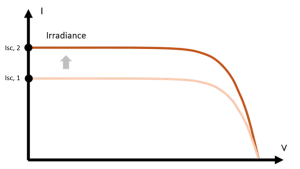
Solar irradiance has a strong influence on the current produced by a PV module. In general, increasing irradiance results in increased short-circuit current, while changes in irradiance have a comparatively smaller effect on voltage.
The relationship is not perfectly linear under all conditions. Cell temperature, spectral characteristics of the incident light and the electrical characteristics of the module also influence the measured IV curve.
This is why IV curves measured under different irradiance conditions should not simply be compared directly. Established correction procedures can be used to translate measured IV characteristics to specified irradiance and temperature conditions.
Accurate irradiance measurement is therefore an important part of meaningful IV curve analysis. The irradiance should be measured at or representative of the plane of the PV module and recorded at the same time as the electrical measurement.
Temperature changes the curve
Temperature has a significant influence on the electrical characteristics of a PV module. As cell temperature increases, the module’s voltage generally decreases, resulting in a reduction in maximum power for conventional crystalline-silicon modules.
Current is affected by temperature to a much smaller extent and generally increases slightly as temperature rises.
The relevant parameter is the PV cell or module operating temperature, rather than simply the ambient air temperature. A module exposed to strong sunlight can operate considerably warmer than the surrounding air.
Temperature therefore needs to be considered when comparing IV curves measured under different conditions. Standardised correction procedures can be used to account for differences in irradiance and temperature.
Soiling and shading
Soiling and shading can alter both the electrical output and the shape of an IV curve.
Soiling reduces the irradiance reaching the cells and can therefore reduce the available current. The effect depends on the amount and distribution of the soiling across the module.
Partial shading can produce more pronounced changes in the curve. Because PV modules contain groups of cells protected by bypass diodes, sufficiently severe or localised shading can cause bypass diodes to conduct. This can produce steps or discontinuities in the measured IV characteristic.
These features can provide useful diagnostic information, but an IV curve should not be used in isolation to identify the cause of a problem. Irradiance, temperature, module configuration, shading conditions and other measurements should all be considered.
What does the fill factor tell us?
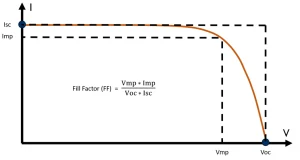 The fill factor (FF) is a parameter derived from the IV curve and describes the relationship between the maximum power point and the product of open-circuit voltage and short-circuit current.
FF = Pmax / (Voc × Isc)
A lower fill factor can indicate increased electrical losses within the module. Series resistance and shunt resistance are two parameters that can influence the fill factor. Increased series resistance reduces the current available at higher operating voltages, while reduced shunt resistance represents increased leakage and can reduce the current available at lower voltages.
Changes in these parameters can therefore alter the shape of the IV curve and reduce the maximum power available from the module.
Recognising common IV curve characteristics
Different conditions can produce different changes in an IV curve.
| IV curve characteristic | Possible contributing factors |
|---|---|
| Reduced Isc | Lower irradiance, soiling, shading or other conditions affecting photocurrent |
| Reduced Voc | Higher cell temperature, module characteristics or possible electrical degradation |
| Reduced fill factor | Increased series resistance, reduced shunt resistance or other electrical losses |
| Steps or discontinuities | Partial shading, bypass diode conduction or module/string configuration |
| Changes in the overall curve shape | Mismatch, degradation, electrical faults or changes in operating conditions |
These characteristics should be treated as diagnostic indicators rather than definitive fault diagnoses. The same apparent change can have more than one possible cause, so the electrical measurement should be evaluated alongside irradiance, temperature, system configuration and other available data.
IV curves and PV degradation
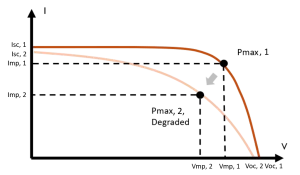
IV curve measurements can also be used to investigate changes in module performance over time. However, degradation does not produce one universal change in the IV curve.
Different degradation mechanisms can affect current, voltage, series resistance, shunt resistance or other electrical characteristics to different degrees. Comparing repeated measurements under comparable conditions can therefore provide useful evidence of changes in module performance.
For this reason, long-term IV curve analysis is most useful when measurements are made consistently and the associated environmental conditions are recorded.
Why environmental measurements matter
An IV curve is only useful if the conditions under which it was measured are understood.
Irradiance and temperature can both change the curve significantly. If these parameters are poorly measured, a normal environmental change can potentially be interpreted as a performance problem in the PV module.
This makes the quality of the supporting measurement equipment important.
For example, irradiance sensors used for PV performance monitoring need to be appropriately installed, maintained and calibrated. The measurement should represent the irradiance experienced by the modules being tested.
Temperature measurement is similarly important, particularly when comparing IV curves measured under different operating conditions.
IV curve measurement in the field
A typical field IV curve measurement involves applying a controlled electrical sweep across the PV module or string while measuring current and voltage.
At the same time, the environmental conditions should be recorded. This includes irradiance and the relevant module or cell temperature.
The resulting IV characteristic can then be assessed against expected performance or compared with previous measurements.
The objective is not simply to produce an IV curve. It is to produce a measurement that can be interpreted reliably.
Correcting IV curves for operating conditions
An IV curve measured in the field represents the module under the irradiance and temperature conditions present at the time of measurement. To compare measurements taken under different conditions, the measured characteristics can be corrected or translated to specified reference conditions.
IEC 60891 provides procedures for correcting measured IV characteristics for differences in irradiance and temperature. Using an established correction procedure allows measurements made under different operating conditions to be compared more meaningfully.
The quality of the correction depends on the quality of the underlying measurements, making accurate irradiance and temperature measurements an important part of the process.
Standards for IV curve measurement
IV curve measurements are covered by international photovoltaic standards.
IEC 60904-1 specifies procedures for measuring the current-voltage characteristics of photovoltaic devices, including PV modules.
IEC 60891 specifies procedures for correcting measured IV characteristics for variations in irradiance and temperature.
These standards provide a recognised framework for obtaining and comparing PV electrical measurements and are particularly relevant when IV curve measurements are being used for performance assessment or testing.
IV curves and long-term PV performance
IV curve measurements are not limited to commissioning and fault finding.
Repeated measurements can provide useful information about changes in module performance over time. Comparing measurements across modules, strings or arrays can help identify underperforming equipment and emerging performance issues.
This becomes particularly valuable on larger PV installations, where an individual underperforming string or module may have little effect on the overall plant-level performance figure.
IV curve analysis can complement other performance indicators such as energy yield and performance ratio. While these metrics show how much energy a plant is producing relative to expectations, IV curves can provide additional information about the electrical characteristics behind that performance.
Getting reliable IV curve measurements
Several factors should be considered when carrying out an IV curve measurement:
- Irradiance should be sufficiently stable during the measurement.
- Irradiance should be measured at the same time as the electrical characteristics.
- Module or cell temperature should be recorded.
- Measurements should be corrected or translated where necessary to allow meaningful comparisons.
- Irradiance sensors and other measurement equipment should be properly maintained and calibrated.
- Installation and sensor positioning should minimise measurement errors.
- Environmental conditions should be recorded alongside the electrical data.
The objective is not simply to produce an IV curve. It is to produce a measurement that can be trusted and compared with other measurements.
From electrical measurements to better PV diagnostics
A PV module IV curve provides a much more detailed picture of module behaviour than a single power measurement.
Changes in current, voltage, maximum power and curve shape can provide useful information about possible causes of reduced performance, while supporting irradiance and temperature measurements help separate environmental effects from changes in the electrical behaviour of the module.
For solar plant operators, EPC contractors and O&M teams, IV curve analysis is a valuable tool for commissioning, troubleshooting and long-term performance monitoring.
Reliable environmental measurements are an important part of that process. Without accurate information about the conditions under which an IV curve was measured, it becomes much harder to determine whether a change represents a genuine performance issue or simply a change in operating conditions.
In photovoltaic performance monitoring, the electrical measurement tells you what the module is doing. Good environmental measurements help explain why.