


Continuous Water Quality Monitoring: What Three Real-World Projects Reveal
Water quality monitoring often starts with a simple question:
What is happening in the water?
The harder question is: when is it happening?
A conventional grab sample gives you a measurement at a particular moment. It can tell you a great deal about conditions when that sample was collected, but aquatic environments are dynamic. Water temperature changes. Salinity shifts. Sediment moves. Rainfall alters runoff. Storms reshape water levels. Biological activity responds to changing conditions.
Sometimes the most important event happens between two sampling visits.
That is where continuous water quality monitoring changes the picture.
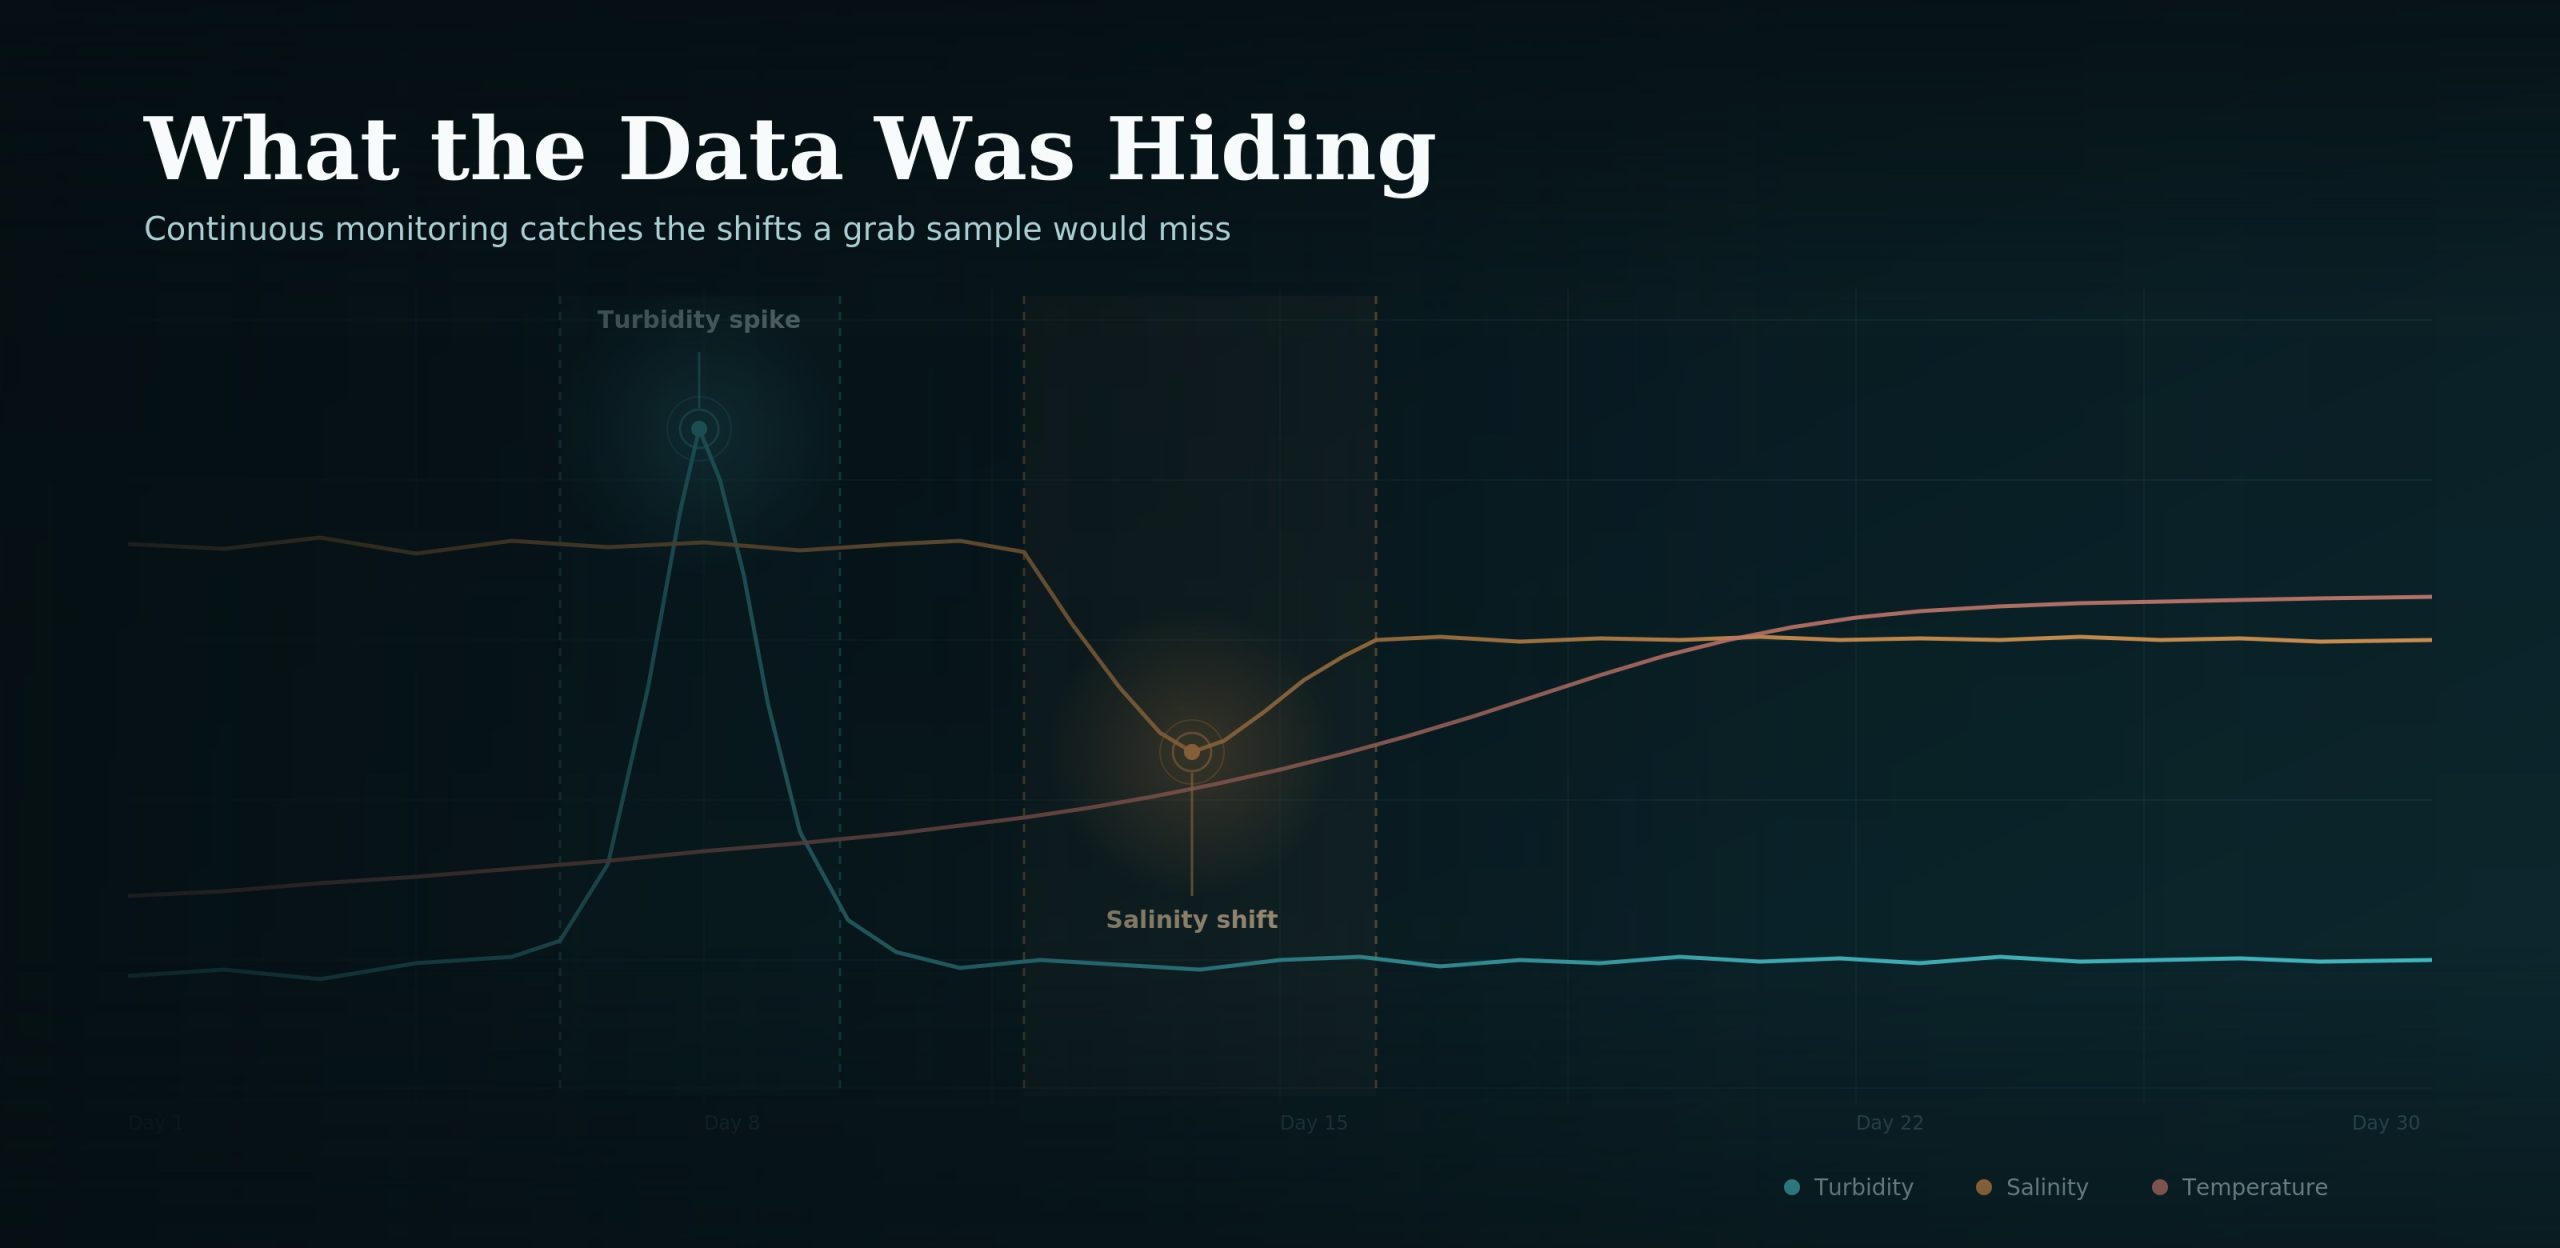
Instead of collecting isolated snapshots, continuous water monitoring creates a record of how conditions develop over hours, days, months and even years. And sometimes that record reveals something nobody was expecting.
A 2024 article in Sea Technology highlighted three projects that demonstrate exactly this, involving dredging, hurricane impacts and oyster aquaculture.
1. Continuous Monitoring Keeps Dredging Projects on Track
Dredging and shoreline restoration can provide major environmental and infrastructure benefits, but disturbing sediment inevitably creates environmental risks.
On Alabama’s Gulf Coast, engineering firm Moffatt & Nichol used continuous water quality monitoring during shoreline restoration projects at Lightning Point and Graveline Bay.
At Lightning Point, the project involved creating approximately 42 acres of new marsh, tidal creeks and upland habitat. The monitoring programme needed to ensure that suspended sediment remained within regulatory limits and that aquatic life was protected.
The team deployed an In-Situ Aqua TROLL 500 multiparameter sonde with VuLink telemetry, monitoring:
Turbidity
Temperature
Salinity
The instrument was positioned outside the project’s mixing zone, while additional measurements were used to establish background conditions and monitor the sediment plume.
This provided something that occasional sampling cannot easily provide: continuous evidence of what was happening during the dredging operation.
The data could be accessed remotely through HydroVu, allowing the team to identify changes and respond when necessary.
Continuous Data Can Even Reveal Problems With the Monitoring System
Long-term water monitoring has its own challenges.
In this project, biological fouling became an issue when barnacles grew over the sensors.
Because the system was transmitting data continuously, the team could see that the signal was deteriorating. Instead of discovering the problem during the next scheduled inspection, they had an indication that something needed attention.
That’s an often-overlooked benefit of remote water monitoring:
The data can tell you when your monitoring system itself needs monitoring.
2. Hurricanes Can Reveal What Models Can’t
Continuous monitoring isn’t only useful when there is a regulatory requirement.
Sometimes it answers questions that have existed for years.
At Stetson University’s Institute for Water and Environmental Resilience, researchers and students deployed five In-Situ Level TROLLs for water level monitoring at locations around Cape Canaveral, Satellite Beach and Edgewater in Florida.
Then Hurricanes Ian and Nicole arrived.
During Hurricane Nicole, the monitoring network captured water-level changes across the area in real time.
Engineers had expected water levels at Cape Canaveral to fall as strong northeast winds affected the area. At Satellite Beach, however, the Level TROLL recorded rising water levels.
The unexpected measurement prompted further investigation.
Researchers connected the observation with an existing theory about the shape of the lagoon. A constricted section of the lagoon could cause water to accumulate during particular storm conditions.
The continuous dataset provided the evidence needed to support that explanation.
And suddenly, a water-level measurement became much more than a number.
It became evidence about how the entire coastal system behaves during a major storm.
Why Baseline Environmental Data Matters
This is one of the strongest arguments for long-term environmental monitoring.
If you only install monitoring equipment after a major flood, storm or environmental incident, you have no historical record showing what conditions looked like beforehand.
A baseline allows unusual events to be placed into context.
That information can ultimately support:
Flood-risk planning
Coastal engineering
Emergency management
Hydrological modelling
Infrastructure design
Environmental management
As one of the researchers involved in the project put it, better designs require better information.
3. Continuous Water Quality Data Can Help Explain Unexpected Oyster Mortality
The third case study demonstrates perhaps the most interesting aspect of continuous water quality monitoring: you don’t always know what you’re looking for until the data shows you something unusual.
Hog Island Oyster Co. in California had observed that oyster productivity and mortality varied between growing sites and throughout the year.
The growers knew the pattern existed.
What they didn’t know was exactly what environmental conditions were driving it.
LakeTech deployed three Aqua TROLL 500 instruments at different oyster leases in Tomales Bay. The sondes measured:
Temperature
Salinity
Chlorophyll-a
Fluorescent dissolved organic matter (FDOM)
Each instrument was connected to telemetry, allowing the data to be viewed continuously.
Then, in June 2023, the farm experienced an unusual increase in adult oyster mortality.
For the first time, the team had continuous environmental data covering an actual mortality event.
The dataset showed changes in dissolved organic matter following heavy rainfall and runoff, followed later by an increase in chlorophyll-a. Water temperatures were also increasing.
The monitoring data did not magically produce a single definitive cause.
Instead, it provided context.
The team could see how environmental conditions had changed before and during the mortality event and begin investigating possible relationships between those changes and oyster behaviour.
That distinction is important.
Continuous monitoring doesn’t necessarily give you an answer immediately.
It gives you the evidence needed to find the answer.
The Value of Continuous Water Monitoring Is in the Timeline
These three projects involved very different applications.
One was concerned with dredging compliance.
One investigated coastal water levels during hurricanes.
One was trying to understand oyster mortality.
But they all demonstrate the same fundamental principle.
A single measurement tells you what conditions were like.
A continuous dataset tells you how those conditions changed.
That timeline can be enormously valuable.
Consider a sudden increase in turbidity.
Was it caused by dredging?
Rainfall?
A tidal event?
A natural sediment disturbance?
Without data surrounding the event, you’re left trying to reconstruct what happened afterwards.
With continuous water quality monitoring, the event becomes part of a sequence.
What happened before it? What happened during it? What happened afterwards?
Those relationships are where much of the real value lies.
More Data Isn’t Necessarily Better Data
Continuous monitoring doesn’t mean putting every possible sensor into the water and collecting enormous amounts of information.
The objective should be to measure the right parameters at the right locations and at the right frequency.
For one application, turbidity and salinity may be critical.
For another, water level may be the primary measurement.
An aquaculture operation might need temperature, salinity, chlorophyll-a and FDOM.
The monitoring strategy should be driven by the question the project needs to answer.
That also means considering where instruments are installed.
In the oyster monitoring project, for example, the sondes were positioned directly within oyster-growing leases so the measurements represented the conditions experienced by the oysters themselves.
The best sensor in the wrong location can still produce the wrong answer.
From Sensor to Decision: How Continuous Water Monitoring Systems Work
A successful continuous water monitoring system is more than an instrument sitting in the water.
The full chain looks something like this:
Sensor → Data Logger → Telemetry → Data Platform → Analysis → Decision
If the data cannot be accessed easily, its usefulness is limited.
Telemetry changes that equation by allowing information to be transmitted from remote water monitoring locations. Instead of waiting for someone to visit the site and retrieve the data, project teams can access measurements remotely and identify changes as they occur.
This is particularly valuable when:
Sites are difficult to access
Conditions can change rapidly
Regulatory limits need to be maintained
Extreme events need to be captured
Multiple monitoring locations need to be compared
Long-term trends are important
And the longer the monitoring programme runs, the more valuable the dataset can become.
The Most Useful Water Quality Data May Be the Data You Didn’t Know You Needed
The three examples in Sea Technology have another thing in common.
None of them were simply about collecting numbers for the sake of collecting numbers.
The data was used to answer practical questions:
Are we staying within our dredging limits?
How does this coastal system respond to a hurricane?
What environmental conditions might be associated with oyster mortality?
Those are questions that require more than an occasional snapshot.
They require context.
They require a baseline.
And sometimes they require seeing something happen while it is happening.
That’s the real strength of continuous water quality monitoring.
It turns environmental monitoring from a collection of isolated observations into a developing story.
And when environmental decisions, infrastructure investment or operational compliance depend on understanding that story, having the complete timeline can make all the difference.
Continuous Water Monitoring Solutions With SME Monitoring
At SME Monitoring, we provide instrumentation and monitoring solutions for applications where reliable environmental data matters.
From multiparameter water-quality monitoring and water-level measurement to telemetry and remote data access, the system should be selected around the environment being monitored and the decisions that need to be made from the data.
Because ultimately, the goal isn’t simply to collect more water data.
It’s to collect the right data continuously enough to understand what is really happening.